Introduction
Log Management is a configurable feature that can be enabled or disabled at the client level through the portal.
Prerequisites
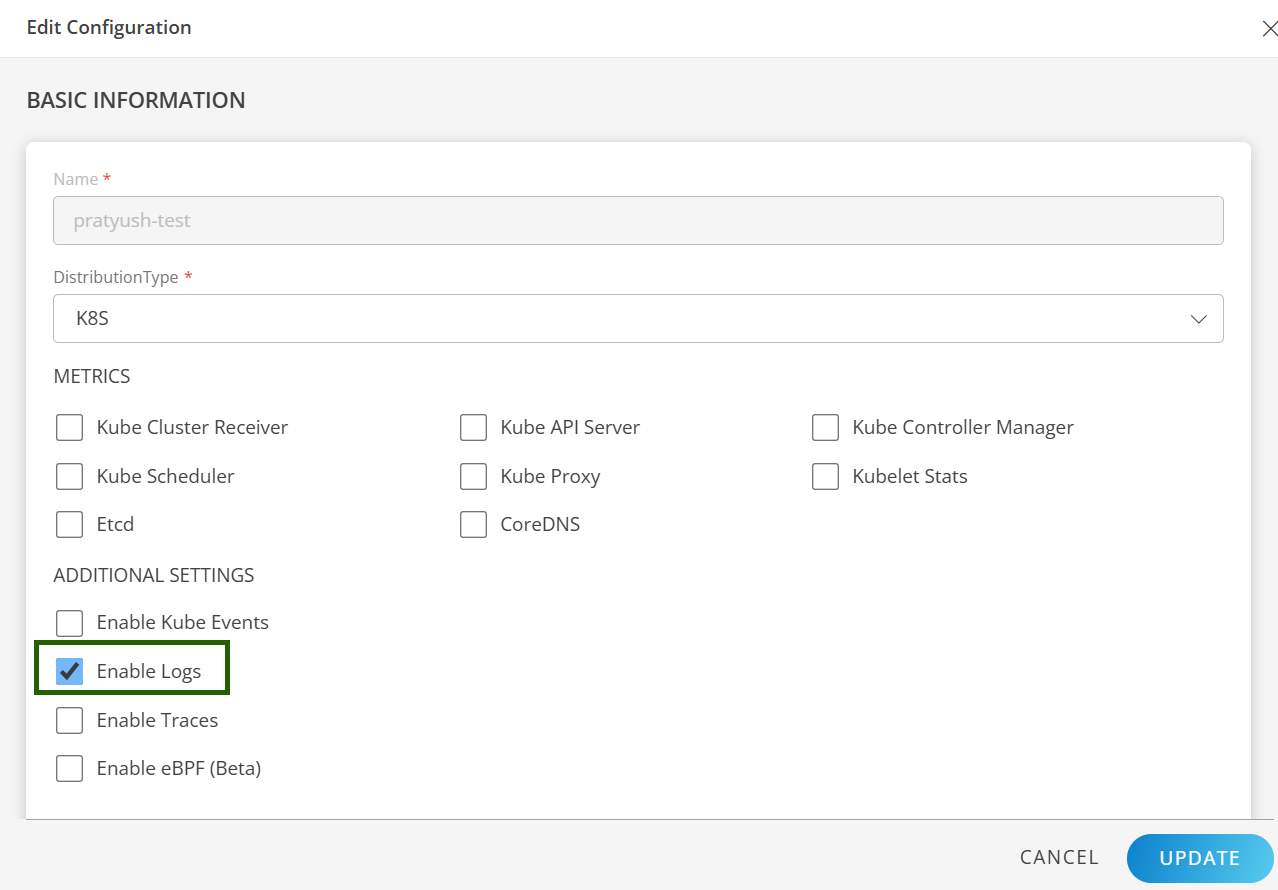
- The Logs Management option must be enabled to use logs management. This can be done either during client creation or after the client has been created:
- While installing the Kubernetes 2.0 Agent, enable the Enable Logs option. For more details, refer to the Installation document.
Agent Manifest File Configuration
Default Behavior
- The agent, by default, collects all pod logs and syslogs from all nodes in the respective Kubernetes cluster. These logs are exported to OpsRamp if:
- The enabled field under the logs section in the downloaded/copied manifest file is set to true.
- The Enable Log Management option is set to “Yes” on the client details page.
- Logs can be viewed in the Logs UI portal, located at: Infrastructure > Logs.
Example logs section:
logs:
  enabled: true
User Configuration of Logs
Default ConfigMap
The default ConfigMap provides a baseline configuration for logs collection, allowing users to customize it later as needed.
To list the default Kubernetes ConfigMap, use the following command:
Default ConfigMap Example:kubectl get configmap opsramp-logs-user-config -n <agent-installed-namespace>apiVersion: v1 kind: ConfigMap metadata: name: "opsramp-logs-user-config-tmp" labels: app: "opsramp-logs-user-config" namespace: opsramp-agent data: logsConfig.yaml: | pods: enable: true additional_labels: namespaces: include: is_include_regex: false exclude: is_exclude_regex: false log_level: "Unspecified" masking: - attribute_type: "" attribute_key: "" text: "" placeholder: "" node: - logSource: syslog enable: true configs: - mount_path: ["/var/log/syslog","/var/log/messages"] multiline: line_start_pattern: '^\s*(?P<timestamp>\w*\s*\d*\s*\d*:\d*:\d*)\s*(?P<host>[^\s]*)' parser_type: "regex" parser_expression: '^\s*(?P<timestamp>\w*\s*\d*\s*\d*:\d*:\d*)\s*(?P<host>[^\s]*)\s*(?P<syslog_tag>[^:]*):\s*(?P<message>.*)$' timestamp_layout_type: "strptime" timestamp_layout: "%b %e %H:%M:%S"Disable Specific Logs: To disable either pod logs or syslogs, set enable: false under the respective pods or node sections in the opsramp-logs-user-config ConfigMap. The agent will automatically apply the changes and restart the OpenTelemetry collector.
Pods Logs Configuration
By default, the agent collects all pod logs. However, users can customize the log collection process using the opsramp-logs-user-config ConfigMap, which is automatically available after the agent is installed.
Default ConfigMap
apiVersion: v1
kind: ConfigMap
metadata:
  name: "opsramp-logs-user-config-tmp"
  labels:
    app: "opsramp-logs-user-config"
  namespace: opsramp-agent
data:
  logsConfig.yaml: |
    pods:
      enable: true
      additional_labels:
      namespaces:
        include:
        is_include_regex: false
        exclude:
        is_exclude_regex: false
      log_level: "Unspecified"
      masking:
        - attribute_type: ""
          attribute_key: ""
          text: ""
          placeholder: ""
Customization Options
If users prefer not to collect pod logs by default, they can disable this feature by setting enable to false in the configuration. This can be done by running the following command:
kubectl edit configmap opsramp-logs-user-config -n <agent-installed-namespace>Adding Additional Labels
The additional_labels field in the ConfigMap allows users to specify key-value pairs that will be added as attributes to each log record.
Steps to Configure:
Run the following command to edit the ConfigMap:
kubectl edit configmap opsramp-logs-user-config -n <agent-installed-namespace>apiVersion: v1
kind: ConfigMap
metadata:
name: "opsramp-logs-user-config"
labels:
app: "opsramp-logs-user-config"
namespace: <agent-installed-namespace>
data:
logsConfig.yaml: |
pods:
enable: true
additional_labels:
app: nginx
env: staging Here,
app: nginx and env: staging are added as labels to all log records.Namespace Filtering
By default, the agent collects pod logs from all namespaces. To restrict log collection to specific namespaces, users need to define inclusion or exclusion rules within the opsramp-logs-user-config ConfigMap.
Steps to Configure:
- Run the following command to edit the ConfigMap:
kubectl edit configmap opsramp-logs-user-config -n <agent-installed-namespace> - Update the namespaces section in the logsConfig.yaml to specify the inclusion and exclusion rules.
Example ConfigMap for Namespace Filtering
Explanation of Fields:apiVersion: v1 kind: ConfigMap metadata: name: "opsramp-logs-user-config" labels: app: "opsramp-logs-user-config" namespace: <agent-installed-namespace> data: logsConfig.yaml: | pods: enable: true additional_labels: namespaces: include: - ^monitoring is_include_regex: true exclude: - monitoring-test is_exclude_regex: false- The include and exclude fields can accept either a
stringor aregexpattern as a namespace. - If a user specifies a regex pattern for a namespace in the include/exclude field, the corresponding flags
is_include_regexoris_exclude_regexmust be set to true. - If a user specifies a namespace that is not a regex pattern in the include/exclude field, the flags
is_include_regexandis_exclude_regexmust be set to false. - For example, the agent collects logs of pods in all namespaces that start with monitoring but excludes logs from pods in the monitoring-test namespace.
- The include and exclude fields can accept either a
Use Case 1:
| Inclusion | Exclusion | Result |
|---|---|---|
| Not set | Not set | Logs of all namespaces will be collected |
| Some filter | Not set | Logs of namespaces that match the inclusion filter |
| Not set | Some filter | Logs of all namespaces except those that match the exclusion filter |
| Some filter | Some filter | Logs of namespaces that match the inclusion filter minus logs that match the exclusion filter |
Use Case 2:
| Use Case | Inclusion | Exclusion |
|---|---|---|
Collects logs of a single namespace agent. | include: - agent is_include_regex: false | - |
Collect logs of all namespaces which start with test only. | include: - ^test is_include_regex: true | - |
Collects logs of all namespaces except the kube-system namespace. | - | exclude: - kube-system is_exclude_regex: false |
Collects logs of all namespaces except those ending with system. | - | exclude: - system$ is_exclude_regex: true |
Collects logs of all namespaces starting with test or kube. | include: - ^test|^kube is_include_regex: true | - |
Collects logs of all namespaces which start with test or kube but exclude testing and kube-system namespaces. | include: - ^test|^kube is_include_regex: true | exclude: - testing - kube-system is_exclude_regex: false |
Collects logs of namespaces that end with agent but exclude any namespace starting with opsramp. | include: - agent$ is_include_regex: true | exclude: - ^opsramp is_exclude_regex: true |
Log-Level Filtering
- Log severity levels are ordered as follows: Fatal > Error > Warn > Info > Debug > Trace > Unspecified/Unknown.
- By default, the agent evaluates log severity for each entry and sends logs to the OpsRamp platform based on this hierarchy.
- Users can filter or drop logs based on their severity level by modifying the
opsramp-logs-user-configConfigMap.
Steps to Configure:
Run the following command to edit the ConfigMap:
kubectl edit configmap opsramp-logs-user-config -n <agent-installed-namespace>Example 1: Filter logs with severity level Warn or higher (includes Warn, Fatal, and Error) and drop logs below Warn (Info, Debug, Trace, Unknown).
apiVersion: v1
kind: ConfigMap
metadata:
  name: "opsramp-logs-user-config-tmp"
  labels:
    app: "opsramp-logs-user-config"
  namespace: opsramp-agent
data:
  logsConfig.yaml: |
    pods:
      enable: true
      additional_labels:
      namespaces:
        include:
        is_include_regex: false
        exclude:
        is_exclude_regex: false
      log_level: "Warn"
Example 2: Filter logs with severity level Info or higher (includes Info, Warn, Error, and Fatal) and drop logs below Info (Debug, Trace, Unknown).
apiVersion: v1
kind: ConfigMap
metadata:
  name: "opsramp-logs-user-config-tmp"
  labels:
    app: "opsramp-logs-user-config"
  namespace: opsramp-agent
data:
  logsConfig.yaml: |
    pods:
      enable: true
      additional_labels:
      namespaces:
        include:
        is_include_regex: false
        exclude:
        is_exclude_regex: false
      log_level: "Info"
Note
- The
log_levelfield only accepts string values and is case-insensitive. - Allowed values: Fatal, Error, Warn, Info, Debug, Trace.
Masking
Masking involves obscuring sensitive or personally identifiable information (PII) in log entries to ensure compliance with data protection regulations.
Steps to Configure:
Run the following command to edit the ConfigMap:
kubectl edit configmap opsramp-logs-user-config -n <agent-installed-namespace>Example Configuration:
apiVersion: v1
kind: ConfigMap
metadata:
  name: "opsramp-logs-user-config-tmp"
  labels:
    app: "opsramp-logs-user-config"
  namespace: opsramp-agent
data:
  logsConfig.yaml: |
    pods:
      enable: true
      additional_labels:
      namespaces:
        include:
        is_include_regex: false
        exclude:
        is_exclude_regex: false
      log_level: "Unspecified"
      masking:
        - attribute_type: ""
          attribute_key: "k8s.namespace.name"
          text: "^ops"
placeholder: "***"- To mask sensitive data (e.g., namespaces starting with “ops”):
- If the namespace is
opsramp-agent, it will appear as***ramp-agentafter masking.
Masking Field Descriptions:
| Description | |
|---|---|
| attribute_type | Specifies the type of attribute being masked. Valid values are: resource and record |
| attribute_key | Specifies the name of the attribute key whose value requires masking. |
| text | Regular Expression for the text that needs to be masked. |
| placeholder | String which will be used for replacing the text specified. |
MaxTime
The term max_time represents the duration from which logs are retrieved from log files. For instance, "Setting MaxTime to 2 hours ensures only recently modified pod log files are processed, which helps reduce overhead and boost performance."
By default, the max_time for Docker engine-based clusters is set to 30 days, equivalent to 720h. In contrast, for CRI-O and containerd clusters, the default setting remains at 2h. Users have the flexibility to adjust this configuration according to their specific requirements.
Steps to Configure:
Run the following command to edit the ConfigMap:
kubectl get configmap opsramp-logs-user-config -n <agent-installed-namespace>Example Configuration:
apiVersion: v1
kind: ConfigMap
metadata:
  name: "opsramp-logs-user-config-tmp"
  labels:
    app: "opsramp-logs-user-config"
  namespace: opsramp-agent
data:
  logsConfig.yaml: |
    pods:
      enable: true
      max_time:
      top_n:
      additional_labels:
Note
Themax_time parameter only accepts hours in the format of 2h, 5h, or 720h. If you have a duration in days, you will need to convert it into hours.Node Logs Configuration
By default, the agent collects node logs, such as syslogs, from all Kubernetes nodes using the opsramp-logs-user-config ConfigMap. This ConfigMap is available immediately after the agent installation.
Default ConfigMap
The following is the default configuration for syslog collection:
apiVersion: v1
kind: ConfigMap
metadata:
  name: "opsramp-logs-user-config-tmp"
  labels:
    app: "opsramp-logs-user-config"
  namespace: opsramp-agent
data:
  logsConfig.yaml: |
    node:
      - logSource: syslog
        enable: true
        configs:
          - mount_path: ["/var/log/syslog","/var/log/messages"]
            multiline:
              line_start_pattern: '^\s*(?P<timestamp>\w*\s*\d*\s*\d*:\d*:\d*)\s*(?P<host>[^\s]*)'
            parser_type: "regex"
            parser_expression: '^\s*(?P<timestamp>\w*\s*\d*\s*\d*:\d*:\d*)\s*(?P<host>[^\s]*)\s*(?P<syslog_tag>[^:]*):\s*(?P<message>.*)$'
            timestamp_layout_type: "strptime"
            timestamp_layout: "%b %e %H:%M:%S"
Customization Options
If you do not want to collect syslogs by default, set enable: false in the configuration by running the following command:
kubectl edit configmap opsramp-logs-user-config -n <agent-installed-namespace>Parser Expression Based on OS Version
- For nodes running Ubuntu version 22.04:
parser_expression: '^\s*(?P<timestamp>\w*\s*\d*\s*\d*:\d*:\d*)\s*(?P<host>[^\s]*)\s*(?P<syslog_tag>[^:]*):\s*(?P<message>.*)$' - For nodes running Ubuntu version 24.0x, update to:
parser_expression: '^(?P<timestamp>\d{4}\W*\d{2}\W*\d{2}\w\d{2}:\d{2}:\d{2}.\d*\+\d{2}:\d{2})\s(?P<host>\w*\W\w*)\s(?P<syslog_tag>\w*\W\d*\W):(?P<message>.*)'
Configurable Fields
| Field | Default | Description |
|---|---|---|
| logSource | syslog | The designated source name for collecting logs. |
| enable | true | This option is set to true by default. If the user wishes to disable it, they can change it to false. |
| configs | required | An array of configurations that specify the parsing logic. |
| mount_path | ["/var/log/syslog","/var/log/messages"] | Indicates the file paths from which logs should be collected. Modify if a custom path is needed. |
| multiline | multiline: line_start_pattern: '^\s*(?P | Syslogs default line_start_pattern. Directs the file_input operator to separate log entries based on a pattern other than newlines. Must include exactly one of line_start_pattern or line_end_pattern. |
| parser_type | regex | Can be either regex or json. |
| parser_expression | '^\s*(?P | Syslogs default parser expression. Specifies the expression used to parse log records accordingly. |
| timestamp_layout_type | strptime | Valid values include strptime, gotime, and epoch. |
| timestamp_layout | "%b %e %H:%M:%S" | Defines the precise layout of the timestamp to be parsed. |
Here are a few key points to keep in mind:
- All fields in parser_expression will be parsed to log attributes only by default.
- Users can customize all fields according to their preferences. Furthermore, they have the flexibility to modify the default configuration, as long as these settings are not the original defaults.
- If a user has any custom configurations for syslog, in addition to the default settings, they can include these configurations in the ‘configs’ field as an array.
Example ConfigMap
node:
  - logSource: syslog
    enable: true
    configs:
      - mount_path: ["/var/log/syslog","/var/log/messages"]
        multiline:
          line_start_pattern: '^\s*(?P<timestamp>\w*\s*\d*\s*\d*:\d*:\d*)\s*(?P<host>[^\s]*)'
        parser_type: "regex"
        parser_expression: '^\s*(?P<timestamp>\w*\s*\d*\s*\d*:\d*:\d*)\s*(?P<host>[^\s]*)\s*(?P<syslog_tag>[^:]*):\s*(?P<message>.*)$'
        timestamp_layout_type: "strptime"
        timestamp_layout: "%b %e %H:%M:%S"
      - mount_path: ["/opt/log/syslog/0.log"]
        multiline:
          line_end_pattern: '^\s*(?P<timestamp>\w*\s*\d*\s*\d*:\d*:\d*)\s*(?P<host>[^\s]*)'
        parser_type: "json"
        parser_expression: '^\s*(?P<timestamp>\w*\s*\d*\s*\d*:\d*:\d*)\s*(?P<host>[^\s]*)\s*(?P<syslog_tag>[^:]*):\s*(?P<message>.*)$'
        timestamp_layout_type: "strptime"
        timestamp_layout: "%b %e %H:%M:%S"
Custom Path Configuration
By default, the agent has access to /var/log. If your log file is outside this directory, specify an alternative mount path using Helm:
helm upgrade <release-name> <agent-chart> --version 0.1.0 --reuse-values --set agent.worker.mountHostPath="{/var/log,/var/mnt}"Note
The/var/log path is crucial for collecting pod logs. If you have custom paths, list them after /var/log, separated by commas (e.g., /var/mnt as a custom path). Also, make sure the --version parameter matches the currently installed Helm version.View Logs in OpsRamp Portal
Users can view logs in the OpsRamp portal from Infrastructure > Logs.
- Default Logs Screen: Access your logs through the Logs UI.
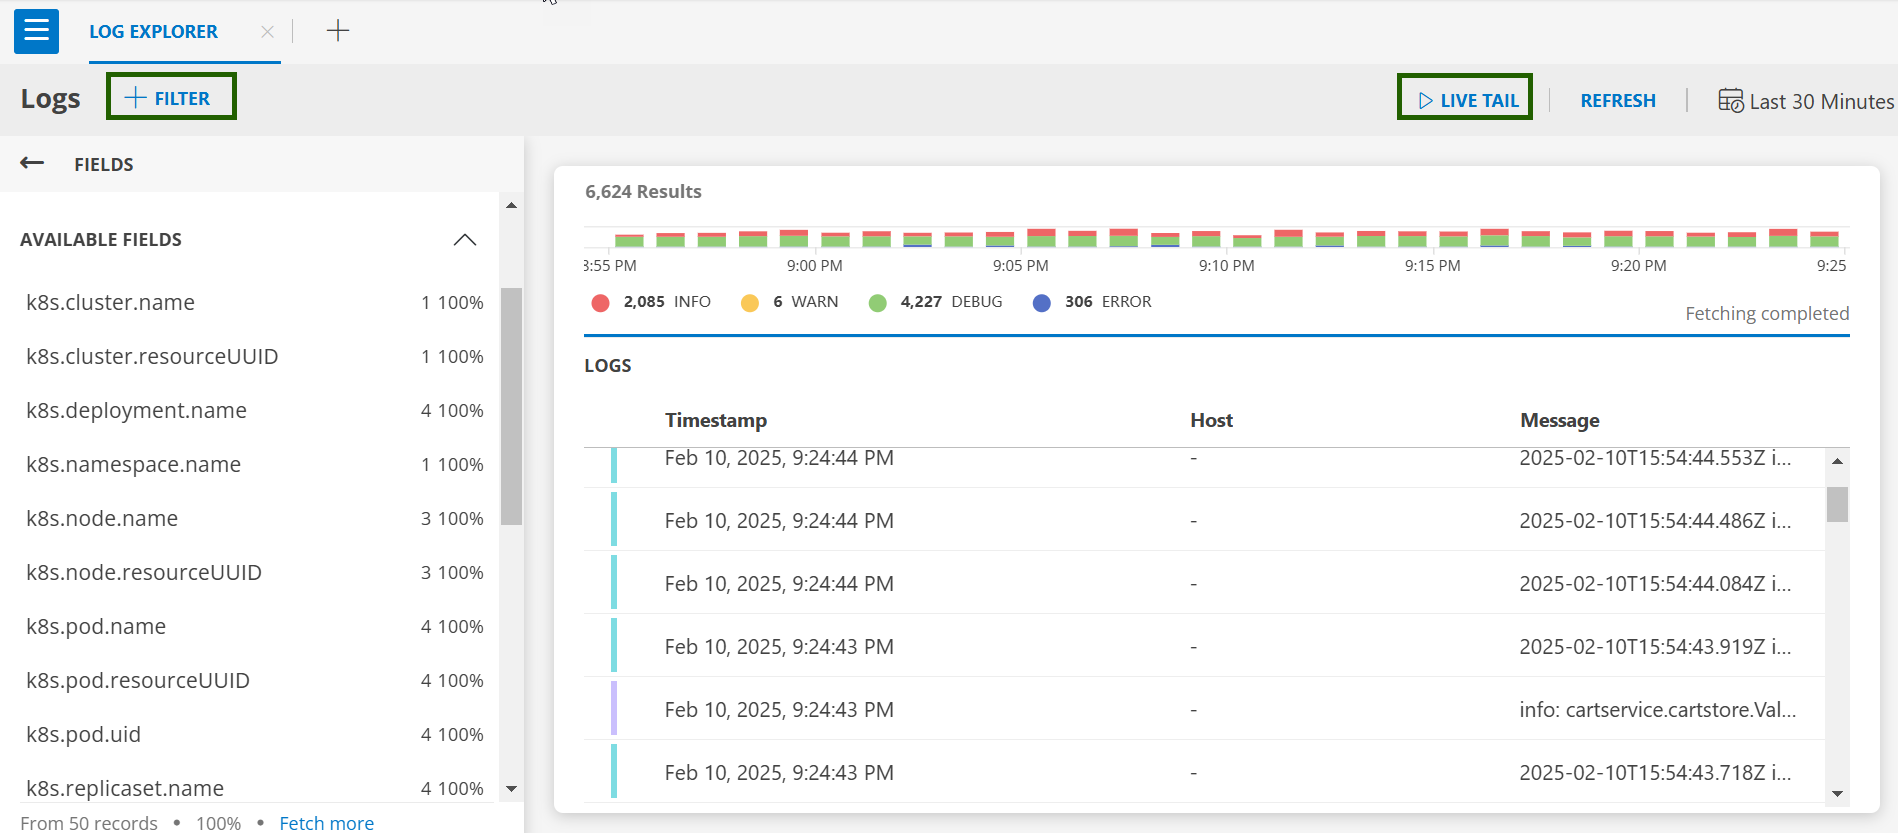
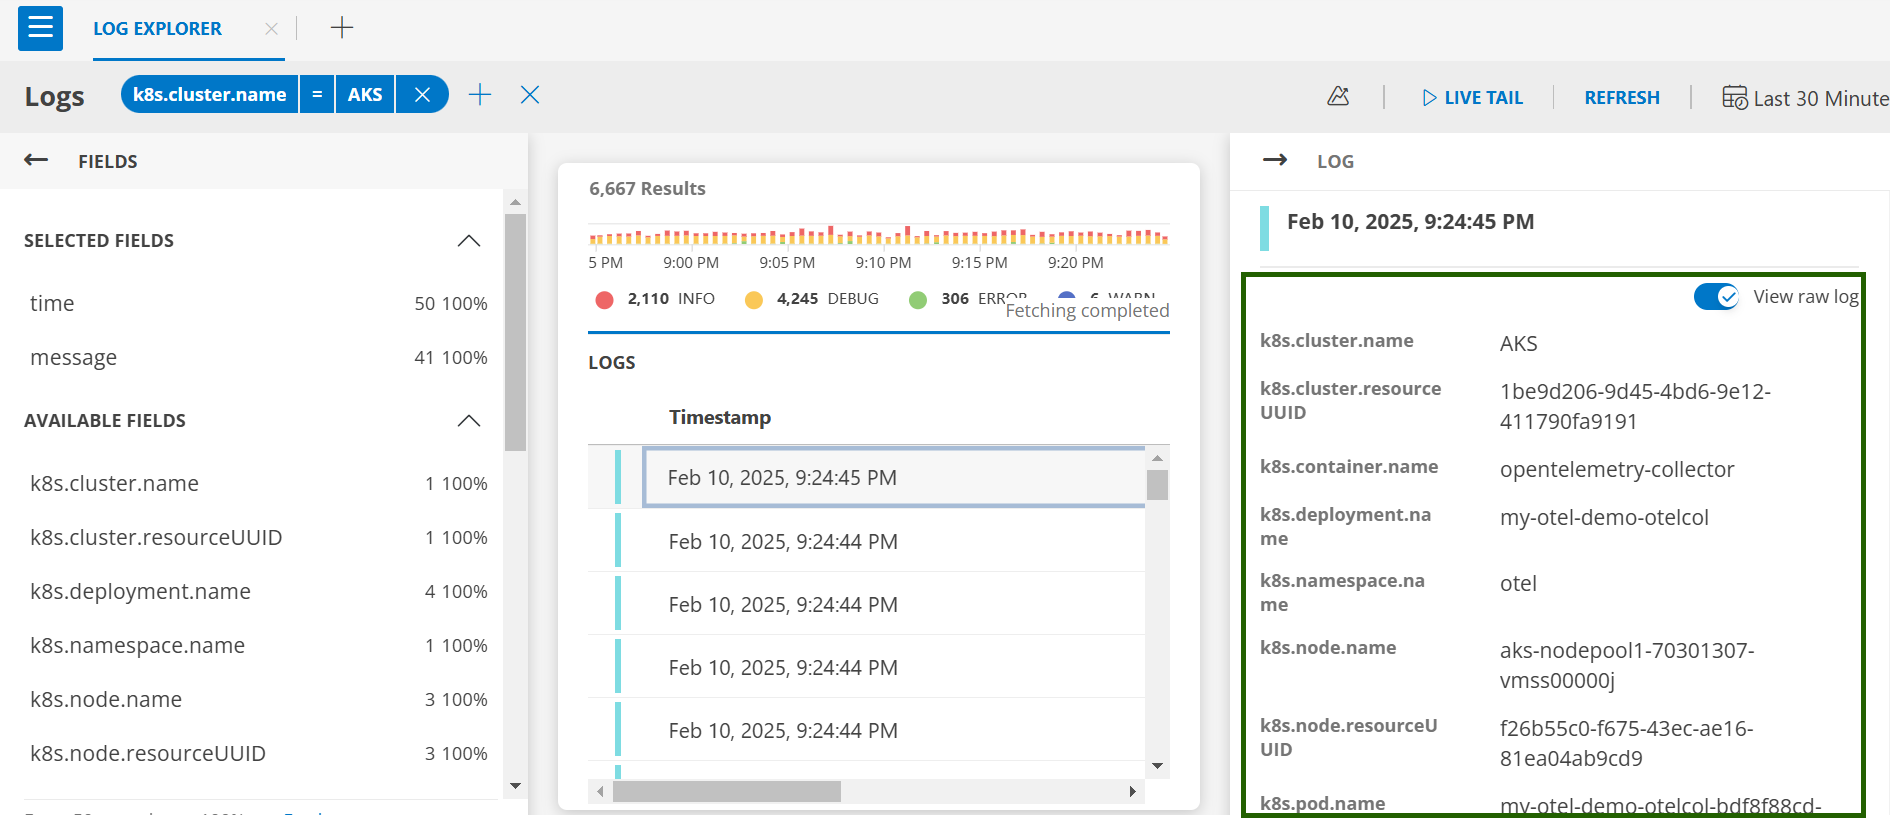
- Logs Filter: Click on +FILTER to select resource types and operators (e.g., Equals, Regex Not Contains).
- Live Tail: Click on LIVE TAIL to view real-time logs.
- Log Details: Click on any log entry for detailed information.
Once you edit the K8s ConfigMap and apply it to your cluster, the OpsRamp Agent will pick up the latest configuration changes within a few minutes. This version organizes the content into clear sections and uses straightforward language for better understanding.